My Traceroute (mtr), combines the features of Ping and Traceroute software in a single application useful for analyzing the quality and performance of network traffic.
In this article we will see how to install MTR Traceroute and how to interpret the returned data.
Generally a test is carried out between a Host, where Mtr is installed, and a Destination Host specified by the user. Mtr, after having determined every single Hop address (Hop are the single nodes (router or other devices) that are located between the source and destination hosts), sends to each single node a series of ICMP ECHO commands so as to being able to check the quality of the connection between the computer of the source and the destination computer.
Installation and use of MTR on Linux
For operating systems based on Redhat, download MTR as follows:
yum install mtr
For Debian based operating systems, download MTR with the following command:
apt-get install mtr
Installed Mtr run:
mtr [destination_IP_address_or_domain]
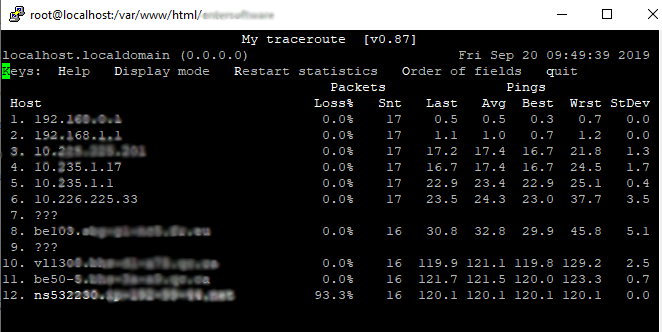
the result is generally a data report like the one below:
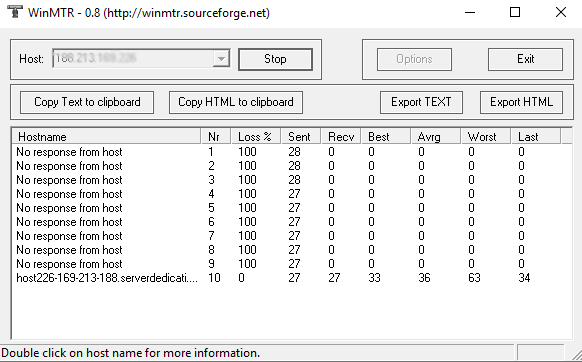
How to install and use MTR on Windows
- Download WinMTR from this page: https://winmtr.it.uptodown.com/windows
- Run WinMtr.exe
- Insert an IP address or a domain name in the Host field and click on “Start”;
the result will be the following:
How to install and use MTR on Mac OS X
You can download the Mtr package from Rudix, a platform that offers several utilities for MAC systems and generally for Linux Based systems.
- Download Mtr here: https://storage.googleapis.com/google-code-archive-downloads/v2/code.google.com/smoothwall-roadster-mtr/mtr-0.80-roadster-x86.tar.gz
- Open a terminal and execute the command “sudo mtr <ip_address_or_domain>”
The result is similar to that reported for Linux Based Operating Systems.
Interpretation of MTR results
Basic concepts:
A reliable test with Mtr should last at least ten minutes.
The MTR output shows data for two sectors of analysis: lost packets and latency. Considering that a single test with Mtr is unidirectional, it would be advisable to trace in both directions. One realizes that the results are very often different in one direction or another. Furthermore, the first Hops shown in the report generally belong to your ISP (Internet Services Provider) while the last Hop belong to the ISP of the destination Host. The Hops between these two groups represent the internet network between the two networks analyzed.
Packet Loss:
On the first column of the report, for each Hop, the percentage of packages that have not reached the destination host is indicated. If in the report we find a single Hop with a high percentage of lost packets this certainly does not represent a network problem. It is generally observed at the ISP address and is caused by bandwidth limits set by the ISP itself or by the fact that the router CPU is busy.
Bandwidth of our ISP causes, on the Mtr report, the presence of a small packet loss in the first hops. These data are very often observable but do not indicate malfunctions or network problems.
A significant loss of data from hop 8 to 13 indicates a serious connection problem and certainly deserves further investigation.
Network latency:
The latency data is shown in the last five columns of the report (the second column shows the progressive number of the ICMP packets sent). Normally the latency increases proportionally to the test execution time. If the growth is proportional and does not present significant jumps, this means that there are no problems on the network. They do not indicate anomalies nor peak values on the single node 6.
Conversely, if from node 8 onwards high latency values are found (compared to the first 6 hops), which persist until the last hops, it could indicate the presence of numerous problems on the network, such as inadequate configurations of network cards or routers , abnormally working services or network congestion.
Conclusions:
For a complete network analysis the results obtained with Mtr are often compared with those obtained with iPerf
The analysis of the Mtr and iPerf reports allows to understand if the network has performance and / or connection problems. Resolving anomalies helps improve the performance of those software that use the internet for file transfer. This is the case of Iperius Remote for remote assistance, but also Iperius Backup, when the items to be backed up, or their destinations, are on Cloud, S3 or FTP servers.
PLEASE NOTE: if you need technical support or have any sales or technical question, don't use comments. Instead open a TICKET here: https://www.iperiusbackup.com/contact.aspx
**********************************************************************************
PLEASE NOTE: if you need technical support or have any sales or technical question, don't use comments. Instead open a TICKET here: https://www.iperiusbackup.com/contact.aspx
*****************************************